


Introduction to Trading View: Features and Benefits
In the dynamic world of financial markets, staying ahead requires real-time data, sophisticated analysis tools, and a platform that caters to both novice traders and seasoned investors alike. trading view has established itself as a leading solution, offering a comprehensive environment for charting, analysis, social interaction, and trading. Its user-friendly interface combined with powerful functionalities makes it an indispensable tool for market participants seeking to maximize their trading efficiency and decision-making accuracy. This article delves into the core features of trading view, exploring its benefits, advanced strategies for seasoned traders, and ways to optimize user experience for better market insights.
Understanding the Core Functionalities of Trading View
Trading view is fundamentally a multi-dimensional platform that integrates several essential components for effective trading and investment analysis. Its core functionalities include highly customizable charting tools, a vast library of technical indicators, social networking features, and real-time data access across multiple financial markets. At its core, it functions as a super-charting platform and social network for traders and investors, connecting like-minded individuals with shared market interests. Key features include:
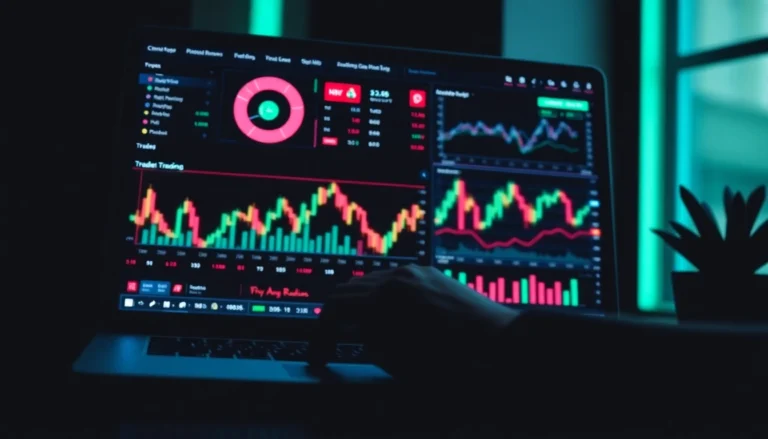
- Advanced Charting Tools: Trading view offers interactive, multi-pane charts that support multiple timeframes and asset classes. The platform supports various chart types such as candlestick, bar, and line charts, along with volume overlays and custom indicators.
- Technical Indicators & Drawing Tools: Users have access to a broad array of technical analysis indicators—moving averages, oscillators, Fibonacci retracements, and more. Drawing tools enable precise trendline, support/resistance, and pattern analysis.
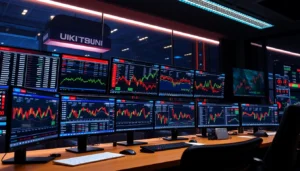
- Real-time Market Data: Trading view integrates live data feeds across stocks, commodities, forex, cryptocurrencies, and indices, ensuring traders are working with the most current information.
- Alert System: Customizable alerts notify traders of significant price levels or indicator signals, facilitating timely actions without constantly monitoring screens.
- Social Features: The platform promotes community engagement through idea sharing, discussions, and collaborative analysis, fostering a learning environment for traders at all levels.
Additional tools such as stock screeners, economic calendars, and integration with brokerage accounts enhance the platform’s versatility, making it a one-stop solution for comprehensive market analysis.
Benefits for Traders and Investors
Trading view’s versatility and rich feature set translate into significant advantages for its users:
- Accessibility and Convenience: Whether on desktop or mobile, traders can access their analysis from anywhere worldwide. The platform’s cloud-based architecture means no software installation is required, simplifying accessibility.
- Cost-Effectiveness: Many features are available for free, with premium plans unlocking additional functionalities such as advanced indicators, multiple chart layouts, and extended data access.
- Enhanced Analytical Capabilities: The ability to customize charts and scripts provides a personalized analytical environment, enabling traders to develop and test unique strategies.
- Community and Collaboration: Sharing ideas, subscribing to other traders’ analysis, and engaging in discussions amplify learning and provide diverse perspectives on market movements.
- Integration with Trading and Brokerage Platforms: Direct trading capabilities streamline the process from analysis to execution, saving crucial seconds in fast-moving markets.
These benefits make trading view attractive to both individual traders and institutional investors seeking a reliable, comprehensive, and interactive trading environment.
Why Trading View is a Preferred Choice in Financial Analysis
Compared to other analysis tools and platforms, trading view distinguishes itself through its combination of features and community focus. Industry experts consistently recommend it for the following reasons:
- Intuitive User Interface: Its design balances complexity and simplicity, allowing users to efficiently navigate through extensive features without feeling overwhelmed.
- Customization and Flexibility: Users can create tailored dashboards, scripts, and alerts suited to their trading styles and asset preferences.
- Active Community and Idea Sharing: The social aspect enhances learning, providing insights from thousands of traders worldwide. These shared ideas often serve as valuable real-world case studies.
- Platform Independence: Compatible across devices and operating systems, facilitating continuous analysis regardless of location or device.
- Continuous Development: Regular updates and feature introductions keep the platform aligned with evolving market demands and technological innovations.
For traders seeking a reliable and versatile platform with a global community presence, trading view often stands out as the top choice.
Using Trading View: Beginner Tips and Best Practices
Setting Up Your Chart Layouts Effectively
Getting started on trading view involves customizing your workspace for clarity and efficiency. Begin by opening your preferred asset chart, then adjust timeframes, chart types, and indicators to suit your analysis style. Use the multiple chart layout feature to compare assets or timeframes side-by-side, which is particularly useful for detecting correlations and divergences. Saving custom templates ensures quick access in future sessions, enhancing consistency across your analysis routines.
Utilizing Indicators and Drawing Tools for Accurate Analysis
Mastering charting tools is vital. Select indicators relevant to your strategy—moving averages for trend direction, oscillators for momentum, Fibonacci retracements for levels of support/resistance. Use drawing tools to mark key levels, trendlines, channels, and patterns like head and shoulders or flags. Practice layering indicators to confirm signals, reducing false positives and increasing confidence in your trades.
Creating Alerts and Watchlists for Timely Decisions
Proactively managing market movement involves setting alerts at crucial price points or indicator signals. Define these thresholds based on your analysis to stay informed without constant monitoring. Additionally, build watchlists for assets of interest, which can be grouped by sector, asset class, or trading strategies. This organized approach saves time and ensures you’re always focused on relevant opportunities.
Advanced Strategies for Trading View Users
Custom Scripting and Pine Script for Personalized Indicators
Trading view supports Pine Script, a scripting language allowing traders to develop custom indicators, strategies, and alerts. This capability empowers users to tailor analysis tools precisely to their needs. For example, traders can script proprietary momentum indicators or backtest trading strategies directly on the platform, ensuring strategies are robust before deployment.
Integrating Trading View with Brokerage Accounts
Linking your trading view account with supported brokerages facilitates seamless order execution. This integration reduces lag, eliminates manual order entries, and enables real-time updates on trade status. Carefully follow setup guides provided by trading view for your specific broker to ensure security and accuracy in your automated or semi-automated trading workflows.
Analyzing Multiple Markets Simultaneously for Diversification
High-performing traders diversify across multiple assets and markets. Trading view’s multi-chart setup and multi-symbol watchlists support this approach by enabling simultaneous analysis of stocks, forex, commodities, and cryptocurrencies. Identify cross-market correlations and divergences using synchronized charts to inform nuanced trading decisions, reducing overall risk.
Optimizing Performance and Enhancing User Experience
Tips for Faster Loading and Better Responsiveness
Optimizing your device’s internet connection, minimizing the number of active indicators, and closing unused tabs help improve platform responsiveness. Regularly updating your browser or app, clearing cache, and disabling resource-heavy extensions contribute to smoother operation, particularly during volatile market hours.
Mobile App Features and Synchronization Across Devices
Trading view’s mobile apps mirror desktop functionalities, allowing traders to analyze charts, set alerts, and share ideas on the go. Synchronization ensures your layouts, watchlists, and alerts are consistent across devices. Leverage mobile notifications to stay informed of critical market movements directly on your smartphone or tablet.
Community Insights: Sharing Ideas and Collaborating with Other Traders
Active participation in the trading view community enhances learning and decision-making. Post your ideas, analyze others’ insights, and participate in chat discussions. Community engagement not only broadens your understanding of various assets but also exposes you to diverse trading styles and risk management techniques that can refine your approach.
Measuring Success and Continuous Improvement
Tracking Key Performance Metrics within Trading View
Utilize built-in tools to monitor your trading performance. Metrics such as win/loss ratio, average profit/loss, and risk/reward ratios help evaluate strategy effectiveness. Regular review of these statistics allows you to identify strengths and weaknesses, informing adjustments for better results.
Leveraging Tutorials, Webinars, and Community Ideas
Stay updated with trading view’s educational resources. Webinars, video tutorials, and detailed community ideas provide ongoing learning opportunities, from basic chart setup to advanced scripting. Continuous education is key to evolving your trading skills alongside market developments.
Updating Your Strategy Based on Analytics and Market Trends
Effective traders adapt. Use analytics data to refine strategies, incorporate new indicators, or modify risk management rules. Remain vigilant to market trends and shifting volatility patterns, leveraging trading view’s tools to adjust your approach proactively for sustained performance.